By: Scott Speck, Regional Digital Ag Lead
Have you ever wished you knew the outcome of a car race as it was happening? As the driver, how would knowing what was coming up ahead halfway through the race change your decisions throughout the race?
As harvest begins, progresses, or finishes, the joy of watching months of hard work come into fruition as the harvest results begin to trickle in is the equivalent of a race finishing. The all-important question of “What did it yield?” starts to take form as plans, curveballs, and trials all come together to provide the report card for the season on yield.
As a leader in digital agriculture, Farmers Edge knows that yield is critical, but also recognizes that yield is difficult to realize until that harvester comes through the field. Many variables can impact yield, both before and during the season, that help or hurt the final number that comes up in the cab during harvest. With that harvest report card coming in, you might find yourself asking questions such as, “how did we come to this number?”
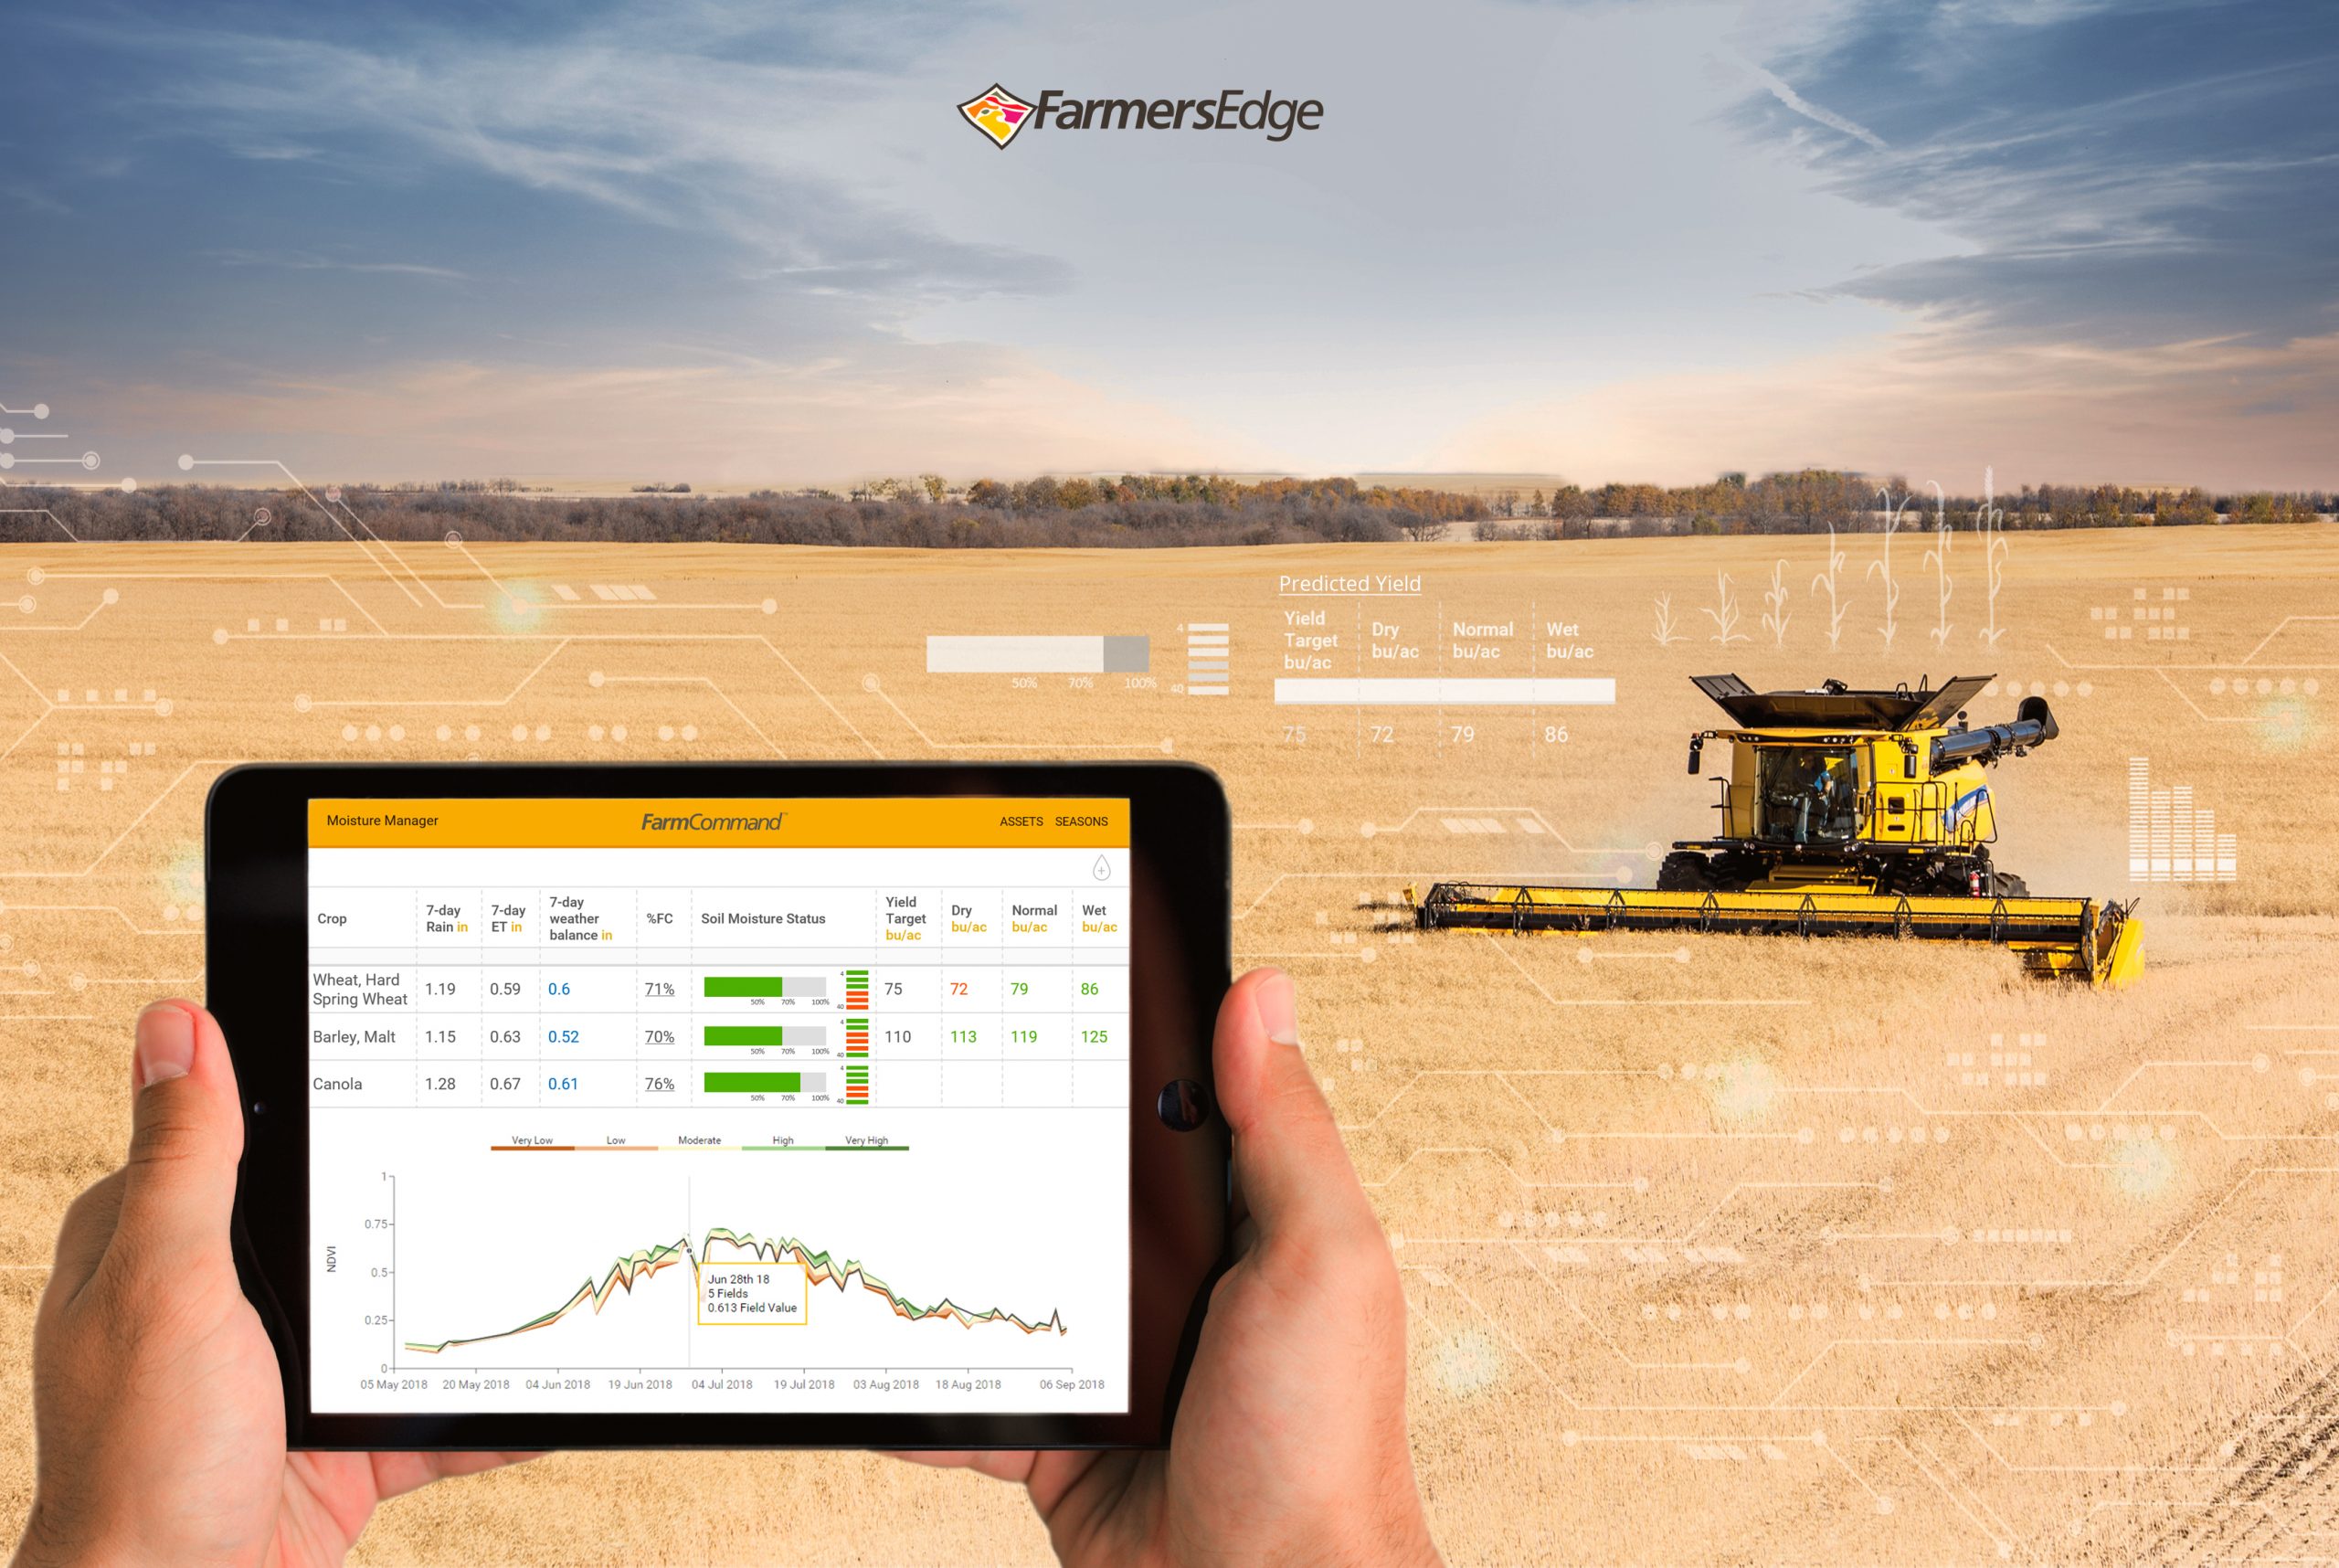
Machine learning continues to be a buzzword in digital agriculture, and Farmers Edge is taking action on these algorithms to weigh multiple sources of data collected with boots-on-the-ground teams, on-farm hardware such as weather stations and soil moisture probes, and big data in the form of remote sensing, high-resolution satellite imagery, soil test information, and analytics to provide Yield Prediction to growers. The company’s roots are founded in the agronomics of growing a crop, and yield prediction is no different, taking data and making it actionable for growers around the world. Yield Prediction enables growers to see what their yields will be across their farm before harvest equipment even touches the field.
Farmers Edge uses multiple datasets to predict yields in five main crops: canola, corn, lentils, soybeans, and wheat. These datasets involve machine learning, agronomic data, crop plans, and field-centric information that impact yield throughout a season.

How does it work?
The following data sources are used in conjunction with one another, each making up a different weighting on yield prediction numbers based on the current scenario for the cropping season in different regions. Farmers Edge data science teams utilize these data sources combined with the latest advancements in machine learning to update yield prediction values each time a critical yield component is impacted.
Preseason Data
Accurate preseason data is critical for setting up the foundation for Yield Prediction. This data consists of information available prior to the crop going into the ground and sets the stage for initial yield prediction readings. Data such as the location of a field, current and past crop, field-centric weather months before planting or seeding, soil test information and data, and regional weather trends for the last decade all are combined to provide insight into starting the season with accurate yield numbers to expect.
In-season Data
After the foundation is set, in-season data provides insight into conditions that impact yield across the growing season. Field-centric data provided by Farmers Edge on-farm weather stations enhance these datasets by providing forecasted and predicted values that are recorded and then reset as data comes in each day, continually advancing the models. Other in-season data such as nutrient application is also considered during the season, whether planned or not, to enhance field diagnostics and deliver predicted yield values.
Crop Specific Data
In-season data also extends to crop-specific data delivered through the large network of local agronomists at Farmers Edge. For the five main crops in yield prediction (corn, canola, lentils, soybeans, and wheat), agronomists at Farmers Edge have identified crop-specific data that impacts yield during a growing season such as moisture during key growth stages or hours above cardinal temperatures for crops during key yield determining periods.
Crop and Field Imagery
Spatial information is taken from high-resolution satellite imagery that can place NDVI crop health values on fields quickly and precisely to look for erroneous values or regional issues with crops that may lead to impacts in yield. These spatial trends help identify if areas are on track for prediction, or if environmental pressures have skewed the prediction values.
Histogram Data
As imagery changes over time, Farmers Edge Yield Prediction models use big statistics to find different distributions in field images over time that then provide insight to a convolutional neural network that can use these changes to predict yield across large areas, such as the US or Canada.
Determining yield before the harvester goes through the field is no easy task, but the team at Farmers Edge is excited to offer yield prediction to growers through complete and accurate datasets. Each of the data sources weigh into yield prediction and can change those weights based on the model parameters.
Commonly asked questions
- What is most critical during this time?
- Why are soils in one location receiving less rainfall and lower temperatures even though all crops were planted in the same week?
- How are fields differing this year compared to the same time last year and the year before?
The model updates through machine learning algorithms that adjust based on the importance at the time of current field conditions and future expectations, but also weigh heavily on continuous field-centric data and ground-truthing done by the boots-on-the-ground team.
One final piece of crucial information to remember is that only considering one parameter or using publicly available data isn’t accurate enough to provide field and farm level conditions across an area. Using large datasets that have been confirmed accurate and provide constant information at the field-level is critical to success. FarmCommand Yield Prediction is another way Farmers Edge is helping growers make decisions to grow their operations.